One method I’ve used in a number of imaging tasks is Color Deconvolution. You can think of color deconvolution as figuring out how much of each of a group of colors contributes to the final color of the pixels in an image.
In my previous work, I’ve used this technique to analyze and quantify the amount of dye in a histologically stained tissue sample. For example, you may want to know how much eosin (a bright pinkish-red dye) and hematoxylin (purplish-blue dye) are present in a region of stained tissue.
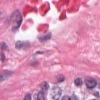
Here’s a magnified image of a piece of tissue stained with hematoxylin and eosin. Those are red blood cells near the top. The dark purple structures near the bottom are nuclei. The rest of the pink stuff is stained mostly with eosin.
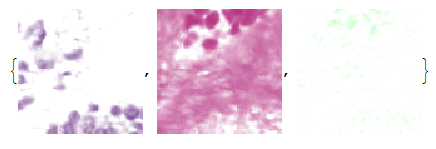
What if you want to know how much of each dye is staining a particular structure. Color deconvolution is the technique to use to find out. In addition to a big pile of numbers, the output can be shown visually to give an impression of the relative intensities. Below is an example of such output

The left sub-image represents the intensity of hematoxylin and is shown in roughly the color of the dye itself. The middle image shows how eosin is distributed through the tissue. The right image is what’s “left over”, neither hematoxylin or eosin.
There are a number of ways to do these calculations. The canonical way is the method first presented by Ruifrok and Johnston in their 2001 paper “Quantification of Histochemical Staining by Color Deconvolution”. This is a supervised method where the user must provide a color basis for the dyes based on a manual calibration process.
A more helpful method might be some unsupervised calculation such as that provided by Macenko et al. in their 2009 paper “A Method for Normalizing Histology Slides for Quantitative Analysis”. However, I haven’t found any unsupervised method that reliably gives results as good as a supervised method.
I’ve put some of my work on the implementation of these calculations up in a GitHub respository at https://github.com/clartaq/Color-Deconvolution. The files there consist of annotated worked examples and code in Mathematica notebooks. The original papers referred to here are also available in the repository. To alter the files you will need a full copy of Mathematica 8. If you would just like to view them, you can use the free Mathematica CDF Player.
 Example of H&E Stained Tissue