Sometimes weakness is a strength. That certainly seems to be the case for the lowly sign test. It is about the simplest statistical significance test imaginable. But if it tells you something is important, it probably is.
Usually when you hear people talk about the “power” of a statistical test, they are referring to the ability of the test to detect a significant difference when one exists. For example, Student’s t test is a favorite and very powerful test for differences in means when you have data meeting the underlying assumptions of the test. The sign test is a relatively weak test in this sense. But many people have the opinion that if “even the sign test” shows a significant difference, it must be true. I’m not sure that’s an appropriate interpretation, but I can certainly understand the sentiment.
My favorite variation is the matched pairs sign test. To use this version of the test each experimental sample has a corresponding control run under as similar conditions as possible with the exception of the experimental variable(s). The results come from evaluating each pair of samples.
Because the sign test makes so few assumptions about the underlying distributions of the data, you can use it on data having only an ordinal scale. For example, you could ask your evaluator to tell you which sample in each matched pair is “prettier” or “smells better” or “makes you feel calmer”. Not the sorts of things you usually associate with hard, scientific measurements.
Once you have evaluated the pairs, the test calculation is based on the number of pairs where the experimental sample was judged “prettier” or “better smelling” vs. the number where the control had that attribute. The number of ties doesn’t enter into the calculation.
The calculations themselves are straightforward, if tedious, applications of the statistics of binomial distributions. Most statistical packages have calculators for the sign test built in. However, since it is such an easy test, it doesn’t really feel right to start up some big behemoth of a statistical program.
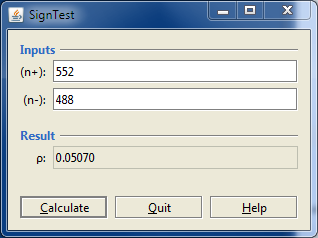
So, many years ago, I created a simple dedicated calculator that my colleagues at work could use themselves. Here’s a screenshot.

In this case, of the 1040 measurements that were not ties, 522 were cases where the experimental sample was judged “better” than the control in some way. In 488 cases, the control was judged better. Doing the calculation indicates that this split is verging on significance as indicated by p = 0.0507.
Update: This program has been updated and is described in a newer blog post here. The original repository has been deleted. See the new blog post for a pointer to the repository for the new program.
This program, including source, is available for download and use under the BSD license as a NetBeans project on BitBucket. It’s written in a combination of Java and Clojure. The user interface is written in Java; the statistics calculations are in a small library written in Clojure. (The Clojure source is not readily visible. It’s inside the BinomialStats.jar as binomialstats.clj.)
For small sample sizes, it is traditional to use the exact calculation of the probability, falling back to the normal approximation for larger sample sizes. That is not the case here. There is virtually no noticeable delay when doing the exact calculation even with large sample sizes, so that is what is used throughout the program.
The program has not undergone rigorous validation, but results have been checked against many cases calculated by Mathematica and Statistica.
Just as in my earlier post about binomial confidence intervals, this program also serves as a reminder of how to do certain things. In this case, it shows how to save and restore preferences from a file on the users system rather than whatever method Java decides is appropriate for the underlying operating system (the Registry on Windows).